Developments in laser technology and significantly increased computing power are making process analyzers available for new applications and even for closed-loop control
Process analytical technology (PAT) has undergone rapid development in recent years. Further developments in laser technology, the miniaturization of optical and electronic components and the implementation of complex chemometrics models (Figure 1) now enable novel and robust field instruments that can analyze even diverse mixtures of substances in a highly selective manner.
This article presents an overview of PAT, and describes some of the applications and benefits of these technologies. It also addresses some of the misconceptions about cost and reliability issues.
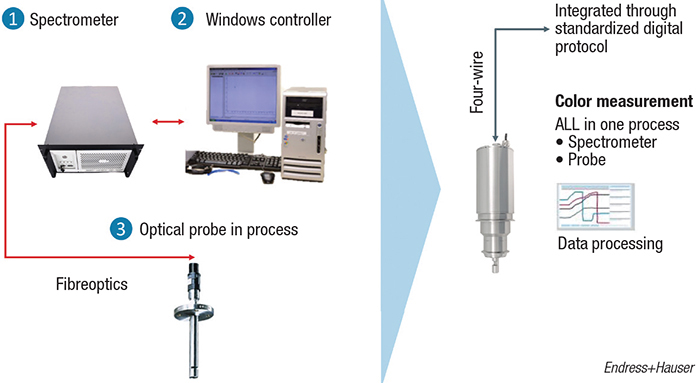
Figure 1. Thanks to technology advances, the complexity of analytical instruments is being reduced. Color measurements, for example, can now be performed with the compact field device (right) that contains everything — spectrometer, probe and electronics for data processing
Introduction to PAT
I wonder if Paul Gmelin had any idea of the success story he had initiated in the chemical process industries (CPI). At the beginning of the 20th century, the workers in the physical laboratory of the Badische Anilin- und Soda Fabrik (BASF) in Ludwigshafen, Germany, was faced with a major challenge: During experiments on ammonia synthesis, it became apparent that the large gas flows had to be monitored in terms of their composition. Gmelin then developed the so-called pipe analyzer. Using online analysis, this analyzer made it possible to measure the ratio of the nitrogen and hydrogen gases during the synthesis, and thus control the ammonia production process.
In 1913, Gmelin received a patent for his pipe analyzer — and modern PAT was born. After that, PAT slowly but surely began its triumphant advance. This is because PAT can be used to measure chemical properties, the composition of mixtures, their concentrations and their desired or undesired changes. PAT therefore brings the laboratory to the process, and offers decisive advantages over offline analysis. This is because traditional offline quality control requires that samples have to be taken and transported to a quality laboratory for analysis. Several hours may pass before the results become available, and this delay prevents results-based process control. PAT delivers results in or near real time. As a result, PAT enables continuous monitoring of production processes, as well as an optimized, target-product-oriented production.
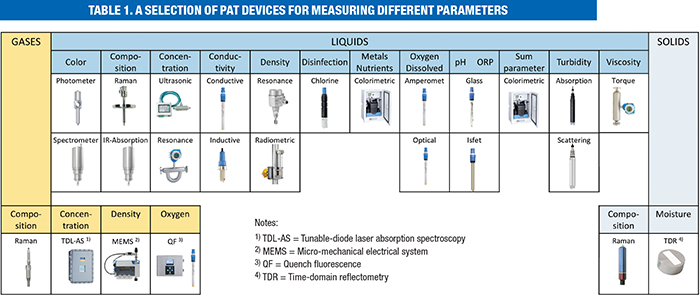
Over the years, PAT has become more and more an established discipline, and is now widely used throughout the CPI. Today, PAT encompasses more than 80 different measuring methods that are used on liquids, solids and gases (see Table 1 for a small selection). Just to clarify, “analytical technology” is a term that refers to both laboratory analysis and process analysis, whereas PAT refers to process analysis. The spectrum ranges from simple measurement methods, such as conductivity, viscosity and pH, through photometry, paramagnetic oxygen measurement and diode-laser spectroscopy (DLS), to new complex methods, such as Raman and ultraviolet (UV) spectroscopy.
Process analysis works in several different ways (Figure 2): inline, with sensors directly in the vessel or in the pipeline; online, with the associated automatic sampling and sample preparation; and at-line, with sequential sampling.
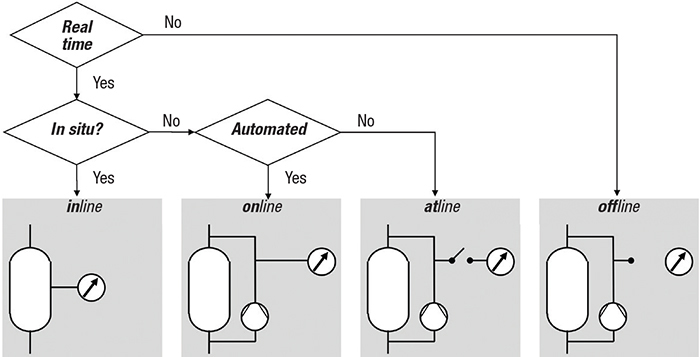
Figure 2. These diagrams, which show typical arrangements for analyzers (bottom) and a decision tree for classifying the analyzers to (top), help clarify the nomenclature for PAT applications (Adapted from Ref. 1, with permission)
The requirements for process analysis, especially in the CPI, are clear and diverse: they should be able to map the process and be used safely in hazardous areas, in harsh environments and in complex media. Due to the fluctuation in the composition of the media, a high level of robustness and selectivity of the process analytics is required. Maintenance should also be as simple as possible. Standardized interfaces for data transmission to process control systems are needed. The goals of using PAT in the CPI are an optimized increase in yield, the capacity of the plant or the reduction of energy or labor costs.
In the past, spectroscopic methods in particular were often not fast enough, too error prone for harsh process environments or not powerful enough. However, advances in laser technology, significant microcomputer power and the implementation of complex chemometrics models now enable novel and robust field devices that can analyze even diverse mixtures of substances highly selectively and reduce complexity for the user. Such devices make it possible to increasingly utilize quality-relevant measurements and analyses from the laboratory to inline and online measurements during production.
For the CPI, this ongoing industrialization of laboratory technologies opens up a wide range of opportunities. With the use of PAT, it is currently possible to achieve higher added value than ever before.
Trends in process analysis
In recent years, great progress has particularly been seen in Raman technology. The laser-based method can analyze gases, solids and liquids down to the level of molecules. Raman spectroscopy is based on the interaction of an incident, monochromatic light beam with the matter under study. Individual photons transfer some of their energy to the molecules, but the molecules can also transfer energy to individual photons in reverse. This light scattering produces a fingerprint-like pattern for each substance that provides information about the composition and nature of the material. In the laboratory, Raman spectroscopy has already proven its worth for complex substances analyses, and commercial Raman systems are now available in robust, reliable inline process solutions. Raman technology offers the possibility of measurement through glass reactor walls or windows.

Figure 3. With a single Raman probe it is possible to monitor — in real time — concentrations of glucose and metabolites during a fermentation process
Due to fast signal processing, measured values are available within 15 seconds (at best; see Table 2) and therefore ensure multiparameter analysis in real time. This sometimes brings decisive advantages in complex chemical processes. Thanks to precise knowledge of the mixture, the process can be optimally controlled, thus reducing raw material and energy consumption. In the production of synthetic rubber, for example, the determination of quality parameters, such as polymer structure and residual monomer content, minimizes waste. Raman spectroscopy can also be used to monitor the production and processing of synthesis gas (syngas; H2 + CO) to generate ammonia or urea, and thus significantly increase yields. New possibilities are also opening up in the life sciences sector, for example in controlling cell growth in bioreactors. Here, the precise determination of the concentrations of glucose and metabolites is important, among other things (Figure 3). Thanks to inline measurement, laboratory release can be replaced by realtime release, so batches no longer have to be held back for days. The monitoring of a distillation process is another important application of Raman spectroscopy (Figure 4).
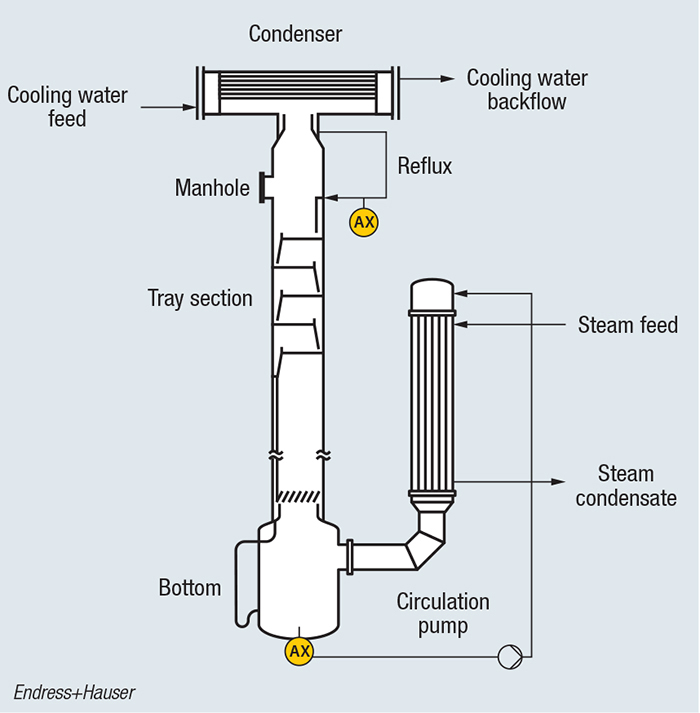
Figure 4. With multi-point Raman probes (AX) strategically placed in a distillation process, it is possible to perform sampling-free process monitoring. The technology is capable of distinguishing among isomers, for example
Decisive further developments also characterize ultraviolet/visible (UV/VIS) and near infrared (NIR) spectrometry. Here, the trend is moving from online to inline measurement due to technical innovations. With inline spectrometers, measurement times in the range of seconds can be achieved, and thus advanced process control can be realized. In addition, the reduced complexity of the instruments leads to a broader range of applications. Until now, the sensitive spectrometers had to be located outside the process and connected to the measuring probes via a fiber-optic cable. Innovative inline spectrometers now integrate the previously separate measurement-probe components, via fiber-optic cable and sensor, into compact and robust devices. This enables them to be directly installed in the process and integrated into the process-control system (See Table 2 for a comparison of Raman and NIR).
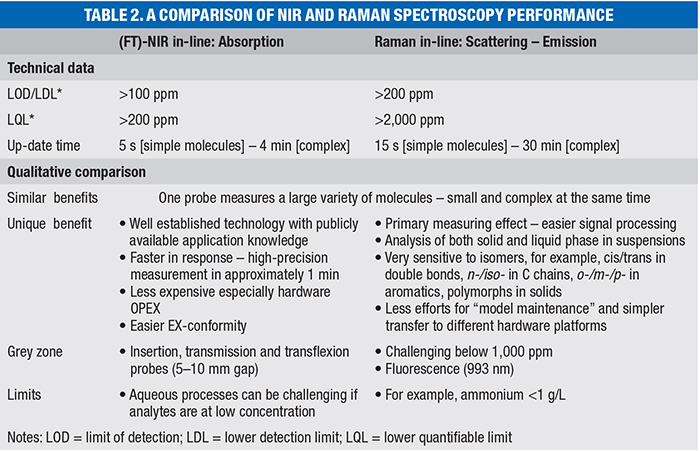
Now that such devices are easier to use, even more plant operators can benefit from the high precision of the spectrometers, for example, in the color analysis of products. Unlike photometers, which operate at only one or multiple wavelengths, these new process spectrometers measure throughout the entire visible range (UV/VIS wavelength ranges from about 200 to 750 nm), and thus the entire color spectrum is covered. The wavelength range of NIR (about 700–3,000 nm) complements the color spectrum, and is capable of exciting molecular vibrations. From the reflected spectra, information about molecular composition can be determined. NIR can be used for both identification and quantification of substances. NIR spectroscopy can therefore be widely used in chemical analysis, for example, to determine water content in feedstocks or products being dried, as well as for quality control and process control.
There have also been further developments in the measuring of moisture in solids and the concentration of liquid solutions. Time-domain reflectometry with intelligent micromodule elements (TRIME-TDR) is increasingly being used for moisture measurement. This special variant of radar time-of-flight measurement is a highly accurate and reliable online “high-tech” measurement technique. In this method, a pulse is generated that travels along a conductor and is reflected. The transit time of the pulse is directly related to the water content or moisture in a material. In contrast to other technologies, the conductivity has no impact on the measurement. As a result, a high accuracy is possible.
For concentration measurements in liquid process media, new systems are available for realtime online measurement that work with surface acoustic waves. These are high-frequency sound waves that can be compared in their physical behavior to seismic waves, such as those that occur in earthquakes. By evaluating the transit time and wave amplitude, acoustic parameters of the liquid, such as the speed of sound, the impedance and the density can be determined, and from this information, concentration can be derived precisely and quickly. Because the system has no moving parts, there is no wear and maintenance is low.
If we consider the area of quality monitoring of feed gases, tunable diode-laser absorption spectroscopy (TDLAS) is gaining in importance, compared to alternative methods, such as gas chromatography (GC). Modern online TDLAS analyzers selectively measure impurities, such as ammonia, moisture or acetylene, with high precision, even at concentrations below 1 part per million (ppm). The analyzers provide reliable measurements within seconds, enabling fast action. They help improve process control, meet product specifications, avoid catalyst poisoning and minimize the need for flaring.
Costs versus benefits
The preceding overview of the advances in PAT shows that its utility is great in all steps of the production process, from feedstock analytics, in-process analytics and product analytics. PAT devices can be used to monitor feedstock purity and catalyst concentration, and to adjust stoichiometry in reaction vessels. Concentration and state data from the process allow an improved understanding of the process via correlation analysis. The rapidly available PAT readings allow improved process control and even realtime process control.
Thus, the use of PAT leads to a higher degree of conversion and end-point-controlled processes. Faulty batches and the associated waste of unusable product are avoided and byproducts reduced. Yield is increased, product quality is improved, the manufacturing process is optimized, and energy and reactants are saved. Plant capacity and availability are increased.
However, there are also reservations about the use of PAT. One reason is that the costs of PAT are often overestimated and the benefits massively underestimated. The most common objection from the CPI is: “But PAT is very expensive, isn’t it?” Indeed, at first glance, the investment costs appear to be high. This is because PAT is produced in relatively small quantities. Moreover, PAT solutions are always tailor-made solutions that have to be individually adapted to the specific process and the user’s requirements. A PAT system is a system consisting of sensor or sampling or sample preparation, analyzer, sample recirculation or sample disposal. If necessary, additional equipment, such as a calibration device, may also be added. As with all investment decisions, however, the benefits of a process-analysis measuring station must be clear from the beginning and the outlay must be in reasonable proportion. In addition, different measuring principles and designs should always be considered.
Then there is the question of maintenance costs: “Aren’t these also high?” Here too, the answer is “yes.” Although there have been strong advances in manageability and robustness, PAT systems actually have a higher maintenance cost that other field devices for measuring non-specific variables, such as temperature, pressure, flow and level. Because many process analyzers are more complex, receive more mechanical components and sensitive parts, maintenance accounts for an average of 5 to 10% of the total cost (capital expenditures; CAPEX) of the measuring point. However, the expense can be reduced in advance by setting up the analytical measuring point to meet the requirements. It is then the task of the analytical engineer to select durable, low-maintenance sensors or to design a customized sampling system with, for example, correctly dimensioned filters, separators and the appropriate materials of construction.
The first PAT devices, such as TDLAS or Raman analyzers, also already have diagnostic, verification and self-monitoring functions. The intelligent technology of modern sensors makes it possible to evaluate numerous sensor signals already in the device.
Standardized diagnostic messages with clear instructions for action enable condition-based maintenance here. The permanent self-diagnosis of the device guarantees safe plant operation with extended test cycles. A guided sequence for device verification without interrupting the process generates unambiguous test results. The automatically generated test protocols support verification in accordance with industry- or country-specific regulations, laws and standards. The monitoring functions allow the implementation of predictive maintenance concepts through trend detection.
Data-based decisions are also supported by intelligent sensor technology, which is now widely used. Such intelligent sensor technology not only digitizes the measured analog values of inline liquid analysis (for example, pH, redox) in the sensor itself, but also reports signal transmission faults and facilitates the replacement of pre-calibrated sensors. Associated software stores all sensor and calibration data. Maintenance and calibration cycles are then no longer processed according to a fixed SOP (standard operating procedure) based on empirical values, but can be planned as required, as the load status of each individual sensor is known.
Expenses can also be reduced by risk-based maintenance. Generally speaking, if planned according to requirements and maintained properly, the availability of analytical measuring points is now so good that they can be used in safety facilities and in the quality control area. Realtime batch release with quality-relevant analytical measuring systems is also not a problem.
On closer inspection, however, it quickly becomes clear the questions “Isn’t PAT very expensive after all” and “Aren’t maintenance costs high?” can be answered with a “yes, but…” This is because replacing tedious laboratory analysis with fast process analysis is worthwhile. Even if the initial costs are high, the return on investment (ROI) is often only a few months.
Examples of PAT applications
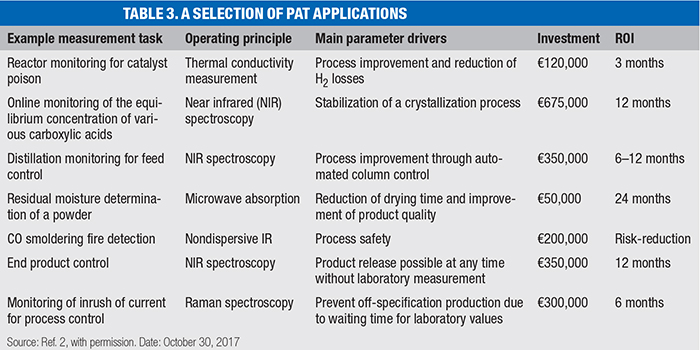
The following real-life examples impressively show the impact PAT has as a “window into the process” compared to laboratory analysis, and how economical knowledge-based production is made possible with PAT. They were recorded by the International User Association of Automation Technology in Process Industries (NAMUR; Leverkusen, Germany; www.namur.net.en) [2]. Additional examples are given in Table 3.
Ingredient analysis. In the past, the quality and optimum composition of the components in the inlet stream of a plant was determined every 2 h by a 40-min laboratory analysis. This practice was replaced by online Raman spectroscopy with a measuring probe. Since then, the measurement is carried out every 3 min during the process. This quickly led to the prevention of off-specification production. If the reduction in laboratory analysis, the purchase and installation of the measuring equipment, the depreciation of the device and the annual support costs are calculated against the preventive off-specification production, the return on investment was 6 mo.
In-process analysis. Online Raman spectroscopy with a measuring probe measures chlorination every 3 min in a batch process. With PAT, laboratory analysis was saved several times per batch, the cycle frequency of the plant was increased and a capacity increase of around 10% was achieved. The reduction in laboratory analysis, the purchase and installation of the measuring equipment, the depreciation of the device and the annual support costs, as well as the capacity increase, also resulted in a ROI of 6 mo.
Release analysis. For residual moisture measurement of a product after drying and before packaging, laboratory analysis was very simple, but also very lengthy at 120 min. Online NIR spectroscopy with up to six measuring heads now determines the residual moisture every 12 min. This makes it possible to quickly detect a product that does not meet specifications. The real advantage, however, lies in the compliance with specification limits. As a rule, specifications are significantly undercut without the use of online measuring equipment in order to prevent rejection by the customer in any case. By exploiting the specification limit, the ROI can now be seen as less than 6 mo., depending on the product price. In addition, energy costs and the associated CO2 emissions are reduced.
These examples all refer to online methods. By eliminating the need for sampling and sample preparation for analysis, inline methods once again ensure lower costs and significantly increased operational reliability with comparable measurement accuracy. For example, inline Raman spectroscopy has been successfully used in urea synthesis to optimize process parameters. The productivity of the plant, which has an annual output of 495,000 tons, was increased by 0.5% as a result. The higher yield from process optimization alone, as well as the savings in energy consumption and emissions, add up to €700,000 to 800,000 annually.
Another question that also arises in the decision-making process is “When should one continue to rely on laboratory analytical analysis, and when to rely on PAT?” The advantages of an analytical laboratory lie in its flexibility. With the appropriate analytical equipment and experienced laboratory technicians, analyses that are not part of the daily routine can also be carried out there. However, apart from extremely time-consuming sample preparation and special analyses, it makes more sense to automate routine analyses.
According to NAMUR, the following rule of thumb applies. From around one analysis per day, process analytics is less expensive than laboratory analytics. Further advantages are that process analytics also provide measurement results over the weekend and holidays without shift work. Current measured values are available without any major delay, and only this allows them to be used in process control systems. And sample falsification due to sampling errors is ruled out. The main disadvantage of offline analysis is also the limited number of samples, the often-necessary personal protection during manual sampling, the possible alteration of the sample from sampling to analysis and the long time usually required to obtain the analysis result and return it to the process.
The future is digitalization
The potential of PAT is far from being exhausted. In addition to technological developments in the instruments themselves, the digital transformation, which is noticeable in all areas, will influence PAT in the future and lead to new fields of application and changes in work flow. As a result, PAT will make production processes even more economical, cost effective and flexible in the future.
In general, digitalization aims to leverage the huge data potential in the field that has been lying fallow up to now. Measured values from field devices and process analyzers, as well as other information about devices, analyzers and the process should be able to be read out and transferred for applications beyond the actual measurement, control and regulation tasks. The data, which have been made accessible via internet technologies, are then to be used through systematic evaluation, comparison, enrichment or linking. Linking device and process parameters thus once again creates the basis for targeted process optimization. The processing of large volumes of data in the cloud with the aid of intelligent algorithms forms the prerequisites for the new digital services and business models.
For starters, the use of data for Industry 4.0 concepts in operation and maintenance is envisaged. The long-term goal is networked sensors, which in turn are the prerequisites of cyberphysical production systems (CPPS) and future automation concepts for the CPI. Work is also being done on virtual sensors in this context. The aim here is to correlate various parameters measured by real sensors and thus determine further parameters that cannot otherwise be recorded directly.
Such applications raise the question of how the measured values of the field devices and other information can actually be transmitted. One approach is to export the data via open interfaces, such as OPC UA. This is a technology generation of the OPC Foundation for secure, reliable and manufacturer-independent transport of raw data and preprocessed information. The actual automation of the plant according to the classic pyramid should remain largely unchanged, thus ensuring plant safety. For Industry 4.0 concepts in operation and maintenance, the field devices are accessed via a second communication channel without influencing the control system. Adapters, gateways and edge devices provide the necessary connectivity on old and new plants. In the future, the Advanced Physical Layer will even enable fast two-wire Ethernet in hazardous areas.
It would be worthwhile to treasure the data from process analytics. This is because, in addition to a deeper understanding of the process and better process control, process analytics also enables knowledge to be preserved, as it provides relevant information about the process. Quality managers obtain a large database that they can use to initiate fundamental changes and minimize deviations in product quality. Evaluations of these data allow, among other things, the identification of “golden batches.”
In addition, the numerous data available in the device on condition and operating history support condition-based maintenance and maintenance personnel in the event of damage. Digital services are already available today that make all field devices and their data accessible from anywhere. The applications (apps) help users, for example, to record and manage all the instruments in a plant, organize device-related documents, or monitor the device status and act correctly in the event of a malfunction.
Remote maintenance systems also allow PAT experts to support maintenance personnel in a plant without having to go onsite themselves. If a fault condition is detected or suspected, a more detailed condition assessment can be carried out, and repair measures can be prepared in a more targeted manner. During onsite maintenance, mobile devices are used with which maintenance personnel can access electronic documentation on site, maintain maintenance histories in the computerized maintenance-management system (CMMS) or initiate procurement processes electronically.
References
1. Minnich, Clemens, Hardy, Sonja, and Krämer, Stefan, Stopping the Babylonian Confusion: An Updated Nomenclature for Process Analyzers in PAT Applications, Chemie Ingenieur Technik, April 19, 2016.
2. Namur, AK-Position 3.6 Analysenmesstechnik-Position: “Prozessanalytik zur Wertschöpfung in der Verfahrenstechnischen Industrie,” October 30, 2017.
Author
 Wolfgang Lubcke is the global business-development manager — Analytics Business at Endress+Hauser Group Services AG (Kägenstrasse 2, 4153 Reinach, Switzerland; Phone: +41 61 715 8147; Fax: +41 61 715 2547; Email: [email protected]). He has been with the company for over 32 years, carrying out different roles from classical product management for level instrumentation towards global responsibility for the chemical industry. With this background, he is now in charge to help moving PAT to become widely acceptable and recognized as a logical extension of traditional instrumentation. Lubcke has an engineering diploma from the Fachhochschule Furtwangen — Hochschule für Technik und Wirtschaft.