This survey of modern particle-measurement technologies demonstrates how selection criteria vary by application
Particulate systems are everywhere; they are responsible for bright red sunsets, the texture of chocolate and the rate of drug delivery in the human body. Particulate processing and size control originated back in prehistoric times where mixtures of pigments were finely pulverized and used in the painting of cavern walls. From those primitive beginnings, the use and processing of particulate matter has grown to be of paramount importance in virtually all modern industries. For example, the flow of granular materials, the sintering behavior of metallurgical powders, the combustion efficiency of powdered coal, and the hiding power and gloss of aluminum pigments [ 1 ] are all particulate systems that are heavily influenced by particle size and shape. Meanwhile, the past decade has seen rapid evolution and growth of applications in nanosized particulate materials, signaling that the increasing importance of particle characterization is set to continue [ 2 – 5 ].
A particle can be defined as single unit of material having discrete physical boundaries that define its size, usually in micrometers, μm (1 μm = 1×10⁻⁴cm = 1×10⁻⁶m). Particle science is typically limited to particulate systems within a size range from 10–3 to 104 μm, thereby encompassing seven orders of magnitudes.
In an attempt to meet the challenge of these remarkably wide particle characterization requirements, from nanosize to millimeters, a considerable number of technologies have been developed over the years to measure the size of particles.
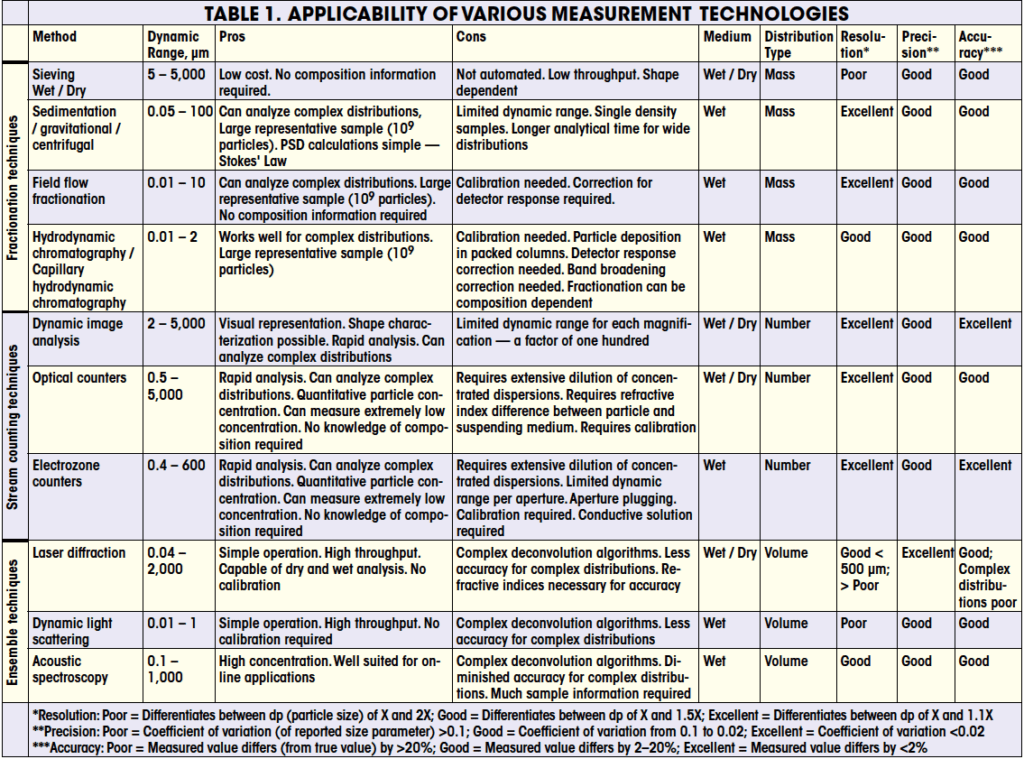
Because of the remarkably wide diversity of technologies for particle sizing applications, each of which explores the size distribution from a different perspective, the size distributions as generated by different methods generally do not agree. A careful evaluation of the particulate system to be evaluated must first be carried out before a particular family of technology and specific instrument can effectively be selected. It is important to clearly define which parameter (such as median, concentration of fine particles, distribution standard deviation, aspect ratio, and so on) is of importance in the measurement, along with the required precision and accuracy needed for each identified parameter. Items that will affect the choice of instrumentation and need to be considered are the working size range, accuracy, detection limits, and resolution of any particular technology (Table 1). Other important items are initial instrument cost, operational cost, throughput, reliability, and quality of the maintenance program from the manufacturer. Measurement validation is a must prior to committing to any particular technology.
 |
| Figure 1. Non-spherical particles can be assigned a number of different diameters depending on which parameter is used in the measurement process |
Effects of particle shape
When it comes to particle characterization, we do not live in a spherical universe, and therefore, particle shape issues are a leading cause of disagreements between instruments. The problem with a simple linear dimensional descriptor, such as diameter, is that it is difficult to adequately and uniquely specify a size for irregular shaped particles. For example, what is the size of the particle at the center of Figure 1? The answer depends on how you measure it. It is common practice to describe a non-spherical particle to be equivalent in diameter to a sphere having the same mass, volume, surface area, settling velocity (uniquely defined parameters) or other defined parameters as the particle in question. For example, laser diffraction instruments report the size of irregular shaped particles as the diameter of spherical particles having a similar diffraction pattern as the particles being analyzed. Given the wide choice of modern particle-sizing technologies that are available, therefore, the reported particle-size distribution often becomes dependent on the particular brand of instrumentation used for measurements.
 |
|
Figure 2. Different techniques measure different aspects of non-spherical |
As an example, Figure 2 illustrates the size distribution of wood flour that passed through a 63-μm sieve. The vertical line on the graph represents the 63-μm dia., which corresponds to the sieve aperture. How can particles up to 200 μm pass through a 63-μm aperture? The answer is that different techniques measure different size parameters of the particles. While the <63-μm sieve dia. measurement is relatively straightforward, the remarkably larger particle size corresponds to a projected surface-area diameter as measured using an optical particle counter. Therefore, when reporting particle size data, it is necessary to specify the method by which the data were generated.
Overview of technologies
A wide variety of particle measurement technologies has evolved to meet the almost endless variability of industrial needs, including both laboratory and online applications. Although there has been a big push in recent years to develop online technologies, the vast majority of characterization is performed in the laboratory. Taking the laboratory to the process is proving to be a particularly challenging problem. As we will see, some laboratory technologies lend themselves better than others for online applications.
All of the modern particle-sizing technologies can be classified into three broad classes:
Fractionation techniques: Technologies that fractionate particles according to size prior to detection and measurement
Stream counting techniques: Technologies that rapidly count and measure particles individually
Ensemble techniques: Technologies that have the ability to measure a large number of particles simultaneously
Depending on the type of information that needs to be extracted from the size analysis, one type of technology may be advantageous over another. For example, particle or stream counters offer the ultimate resolution, but may suffer from poor counting statistics for wide distributions. Ensemble techniques offer high precision, but can suffer from lack of accuracy for multi-modal, or more complex distributions. Fractionation techniques offer fairly high resolution and high accuracy, but generally lower throughput especially for wide distributions.
Every method, with the exception of imaging technologies, provides the measurement of an equivalent spherical diameter in one form or another. The spherical diameter information can be deduced indirectly from the behavior of the particles passing through restricted volumes or channels under the influence of gravity or centrifugal force fields, and from interaction with many forms of radiation, or ultrasonic waves. In addition to size information, image analysis is the sole technology that can also provide reliable shape information.
Fractionation techniques
This family of techniques includes several distinct technologies in which particles are separated by size before being measured. Among the most common of these techniques are sieving, sedimentation, hydrodynamic chromatography and field flow fractionation. Some fractionation techniques make use of models that are based on first principles of physics and therefore do not need calibration, while others do require calibration. Both the dynamic range and the resolution of these techniques are governed by the efficiency of the separation process they utilize. The resolution is typically better than ensemble techniques, but below that of counting methods. The dynamic range depends on the particular technique being utilized; wet and dry sieving can be used for measuring particles in the size range from five to several thousand microns; centrifugal, and gravimetric sedimentation is useful for particles from about 0.05 to 100 μm; and hydrodynamic chromatography and field flow fractionation are typically used for particles smaller than a few microns. The fractionation family of methods does not lend itself to online or in situ applications, and therefore has not been developed for in-process measurement.
Sieving. Sieve analysis is the workhorse of the mineral processing industry to assess ore crushing for mineral release; in heavy construction work to evaluate soils, sand, and gravel for foundation stability; in powder metallurgical operations for porosity control; and in agriculture for grading seed quality and uniformity. One major advantage of sieving is that it is straightforward and low cost. However, analysis must include attention to details, or erroneous results can ensue. The finer mesh sieves can be easily damaged by careless handling and tend to become clogged with irregular shaped particles. Regular inspection and maintenance is a must when using sieves. Many practitioners tend to forget that a sieve is a precision instrument and should always be treated as such. Sieves are available with openings from approximately 5 μm upward in several series of sizes in geometric progression (square root of 2 or 4th root of 2). Wire woven sieves have approximately square openings; and electroformed sieves have round, square, or rectangular openings. Wire woven sieves tend to be sturdier and less expensive than electroformed sieves, and have a greater proportion of open area. They are much more frequently employed than their electroformed counterparts except in the very-fine particle range where only electroformed sieves are available.
Dry sieving is typically performed by shaking the stack manually, or using a mechanical vibrator, or with air pulses of sonic frequency. In another device, agitation on the sieve is provided by a rotating air jet [ 6 ]. In wet sieving, water or another liquid that does not dissolve the material, is continually applied to facilitate particle passage. A detergent is frequently added to promote particle dispersion during wet sieving, and antistatic additives have been used to help fractionate systems of larger particles that have a high level of static cohesive forces. The sieve diameter of a particle is therefore defined as the size of the sieve aperture through which the particle in question just passes through. Mass fractions of the particles are then presented in tabular or graphical form.
Sedimentation. Sedimentation analysis is suitable for a wide variety of materials and is used for both quality control and research work, such as agglomeration studies, and gives well-defined, relatively high resolution results. The technique has been employed in the evaluation of soils, sediments, pigments, fillers, carbon black, phosphors, clays, minerals, photographic halides, as well as organic particles. Measurement of the settling rate for particles under gravitational or centrifugal acceleration in a liquid provides the basis of a variety of techniques for determining particle sizes. Gas-phase sedimentation has been investigated [ 7 ], but difficulties achieving adequate particle dispersion and the effect of electrostatic charging have restricted this application. In liquid-phase sedimentation, the particles initially may be distributed uniformly throughout a liquid (homogeneous start) or concentrated in a narrow band or layer at the liquid’s surface (line start). The particle movement is monitored using light or x-ray beams. The particle size determined by sedimentation techniques is an equivalent spherical diameter, also known as the equivalent settling diameter, which is defined as the diameter of a sphere of the same density as the particle that exhibits an identical free-fall velocity. The terminal velocity of the particle is determined from Stokes’ law, given by Equation (1):
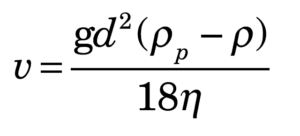 (1)
(1)
Where: v is the terminal velocity of the particle, g is the gravitational constant, d is the particle diameter, ρ p is the particle density, ρ is the liquid density and η is the liquid viscosity.
One of the key implications of Stokes’ law is that the larger particles settle at a faster rate, which is proportional to the square of the diameter ( v ∝ d 2). Therefore, the settling rate of a 10 μm particle will be 100 times that that of a 1 μm particle. This square relationship implies good separation efficiency on the basis of particle size, which in turn gives sedimentation methods their relatively high resolution.
 |
|
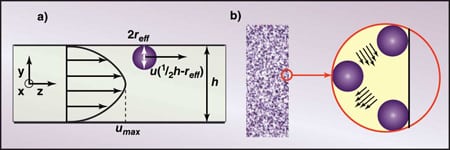
Figure 3. Field-flow fractionation is carried out in ribbon-shaped channels from |
 |
|
Figure 4. In CHDF (a) and HDC (b), the larger particles are excluded from the |
Field-flow fractionation. Field-flow fractionation (FFF) has been widely used in characterizing the size of biological materials and in the paint and pigment industry. It is a separation technique where a field is applied perpendicular to a particle suspension flowing through a micro channel (Figure 3). The applied field pushes the particles toward the bottom of the channel while diffusion works to oppose the applied field to form a balance where particles of different sizes are confined to specific regions of the channel. Since a parabolic flow exists within the channel, the particles that are confined to a region close to the center of the channel will travel faster than those that are confined to a region near the bottom of the channel thereby separating the particles. A number of fields have been successfully applied, namely gravitational, centrifugal, magnetic, thermal and cross flow.
Hydrodynamic chromatography. Capillary hydrodynamic fractionation (CHDF) and hydrodynamic chromatography (HDC) are two other separation techniques that make use of microchannels. In these techniques, particles carried in an elution fluid are separated in a microchannel (Figure 4a) or a column packed with spherical material (Figure 4b). Since the larger particles are excluded from the boundary layers as the result of their size, they travel in the central regions of the eluent flow where the velocities are higher. Smaller particles gravitate to the slower flows near the wall of the micro channels and as a result experience lower eluent velocities. This size-dependant flow sampling creates a fractionation where large particles elute from the microchannels first and smaller particles last. The composition of the eluent is carefully chosen to control the attraction of the particulate to the microchannel surface. The various size species eluting from the microchannels are detected using an optical detector. Instruments are calibrated with a series of standards of known sizes. This technology has been used for measuring the size distribution of colloidal systems such as latex, organic pigments, carbon black, emulsions and liposomes.
Stream counters
In stream counters, also referred to as particle counters, the particles to be analyzed are moved through a sensing zone where they are detected and analyzed one at a time, thus producing a number-based size distribution. Several of those methods do not operate on first principles of physics, and therefore need to be calibrated. They offer the ultimate in resolution, but can suffer from poor counting statistics when the data are converted from a number distribution to a mass or volume distribution where the size range is greater than a factor of 50 (the ratio between the smallest and largest possible values). In an effort to increase the dynamic range of these techniques, most of the modern instruments come equipped with multiple sensors, or magnifying optics. Some of these techniques have been successfully used in online or at-line applications.
 |
|
Figure 5. This dynamic image-analysis configuration uses |
Dynamic image analysis. Particle characterization by image analysis consists of examining and measuring the size or shape of particles that have been optically magnified. The pioneering studies of particle characterization by imaging technologies were carried out in the late 1960s and early 1970s. The projected area of the profiles were estimated by direct comparison with sets of reference circles, known as a reticule, engraved on the eyepiece of the microscope. The ever-increasing power of data processing capability, coupled with the high performance and falling costs of television cameras and scanners has led to the development of highly sophisticated and powerful image processing and analysis systems, which emerged in the 1980s and early 1990s. Further advances in microelectronics, such as faster image capture and processing, have led to the transformation of the highly sophisticated modern image analyzer into a much faster particle-size and shape analyzer. This new breed of instruments (Figure 5) has gained considerable popularity within the past decade. The particles to be analyzed are dynamically presented to the instrument as dry particles carried in a gas stream, or falling from a vibration feeder, or as liquid dispersions moving through thin flow cells. This type of dynamic image analysis system is normally used for particles greater than 5-μm dia. The transformation in technology has made it possible to move from image analysis systems that gave a lot of information about few particles, to systems that quickly give a lot of information on a lot of particles.
Imaging technology has also been used for online applications in the chemical, pharmaceutical and oil-and-gas industries.
 |
|
Figure 6. An optical particle counter can measure |
 |
|
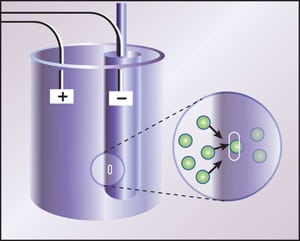
Figure 7. In a resistazone counter, a pressure |
Optical particle counters.Another stream counter uses the principle of light blockage to count and measure the size of individual particles. These instruments are widely used for monitoring contamination levels in oil, hydraulic fluids, water treatment facilities, and any other low level particulates in liquids. As a particle passes through the sensing zone (Figure 6), it projects a shadow onto the detector which in turn produces a pulse that is proportional to the amount of light blockage. The pulse height is compared to a calibration curve generated from uniform particles of known size, typically latex standards. A highly diluted particulate dispersion is a must to avoid coincidence counting (multiple particles in the sensing zone). Coincidence will affect the accuracy of the measurement in two ways: the particle count or concentration will be underestimated, and the particle size distribution (PSD) will be overestimated. It is therefore important to remain within the concentration limits of the instrument, as recommended by its manufacturer.
Optical counters have been used online for monitoring particulate levels of clean liquids and gasses, well below the parts-per-million (ppm) level. For higher concentration slurries, a precise sample volume is extracted from the process, injected into an autodilution system, and analyzed for size and concentration analysis.
Electrozone counters. Another instrument that was introduced in 1954 by Wallace H. Coulter uses the principal that when particles dispersed in an electrolyte move through a small orifice, the electrical resistance of a current flowing through the orifice changes. Furthermore, the change in electrical resistance is proportional to the volume of electrolyte displaced by the particle. The basic principle behind this instrument is illustrated in Figure 7. This technology can be found in virtually all hospital laboratories for analysis of complete blood count (CBC), and has also be used extensively in the paint, ceramics and glass industries.
Nano tracking analysis. A technique has recently been developed where the positions of individual nanosize particles undergoing Brownian diffusion are tracked in realtime using a charge-coupled device (CCD) camera mounted on a microscope. A tracking image-analysis software package measures the displacement of the particles in a two-dimensional plane using a series of successive images and calculates the diffusion coefficient from which the hydrodynamic diameter of the particle can be evaluated. Since the particles being tracked are too small for direct observation, a highly focused laser beam is used to illuminate the particles, which in turn scatter light towards the microscope objective. The lower limit of this technique is dependent on the optical properties of the particles, and range from 10 to 35 nm. The upper limit is around 1 μm.
Ensemble techniques
Although ensemble methods are the least accurate and suffer from the lowest resolution as compared to the other classes of techniques — especially in cases of non-spherical particles and wide distributions — they are the most widely used within virtually all industries. Despite the inherent disadvantages, ensemble measurement techniques are popular because they are typically simple to use, offer high throughput, have the ability to generate high-precision data and generally do not require calibration. Very often, in quality control, precision is the most important attribute of a measurement to insure consistency in the product. Ensemble techniques have been the most popular choice for online applications, with and without dilution.
 |
| Figure 8. In a laser-diffraction-based size analyzer, the size distribution of a particle population is calculated from the group diffraction pattern projected onto the detector array. The large angle detectors are used to extend the lower limit of the size measurement. Laser diffraction is the most popular method of particle size analysis today |
Laser diffraction.Particle sizing by laser diffraction is the most popular method of particle size analysis today and models are available from many vendors. In laser diffraction, size distribution of a population of particles in suspension is measured from the angular variation in the intensity of light scattered by the particles. Modern instruments are equipped with modules for liquid dispersion as well as aerosol dispersion for wet or dry analysis. A particle with a diameter much larger than the wavelength of light scatters predominantly in the forward direction (Fraunhoffer diffraction), while a particle with a diameter that is of the same order as the wavelength will scatter more efficiently at wider angles. Figure 8 illustrates the basic principle behind laser diffraction instruments for the determination of particle size distribution. As an electromagnetic wave encounters a particle, a number of processes can occur, depending on the size and optical properties of the particle. Light and particle interaction can take place through external reflection, internal reflection, absorption and diffraction. If the particle diameter is large compared to the wavelength, (particle diameter > 20 μm) diffraction is the only significant phenomenon that needs to be considered. If the particle diameter is of the same order as the wavelength, a more complex scattering theory (Mie scattering) is applied where all light-particle interactions need to be considered. As a result, the reliability of laser diffraction instruments will be highly dependant on the optical system implemented and the robustness of the scattering models used when analyzing particles in the size range below a few microns in diameter.
 |
| Figure 9. This automated sampler is capable of extracting representative samples for dry material being transported through pipes. The sampled material is transported from the sample outlet and delivered to the instrument for analysis Source: Sympatec GmbH
|
Over the past decade, there have been developments that extend the application of laser diffraction technology into in-process monitoring for both dry and wet applications. For dry applications, a side stream from the process line is drawn and diluted with clean air if necessary and delivered to the sensing zone of the instrument. To insure representative sampling, automated samplers (Figure 9) have been designed to draw a small sample throughout the cross section of a process pipe. This technology has been successfully utilized for online monitoring of grinding and air classifying of powders, and has been used extensively in the cement industry.
For wet analysis, the key is to extract a representative sample from the process, dilute the sample and deliver it to the analyzer. Heavy dilution on the order of 1,000:1 is sometimes performed using multistage samplers.
Dynamic light scattering. Another ensemble technology for measuring colloidal systems that has become popular over the past decade uses the Brownian diffusion of the particles to deduce the size distribution. This technology is known as dynamic light scattering, photon correlation spectroscopy or quasi-elastic light scattering. As a beam of laser light shines through a colloidal dispersion, a large number of small particles encountered by the beam will scatter light in all directions. Careful monitoring of the intensity of this scattered light reveals fluctuations in its intensity over time. Those fluctuations, in which the size information of the particles is buried, are caused by the random Brownian motion of the particles. The higher diffusivity of the smaller particles generates higher frequency fluctuations, while the larger particles generate lower frequency fluctuations. A signal processing technique known as autocorrelation is typically used to extract the particle size information. This technique is suitable for any colloidal dispersion ranging in size from about 0.005 to 1 μm, is very reliable for unimodal distributions, and has been used extensively for the study of microemulsions, liposomes and latex. For suspensions having broad distributions, or for multimodal distributions, the extraction of the particle size distribution from the autocorrelation function becomes extremely difficult, and is therefore unreliable.
Acoustic spectroscopy. Recently, a technique has been developed to probe particles suspended in a liquid medium using ultrasound, thereby exploiting the inherent advantage that sound can propagate through opaque, high-concentration dispersions. Furthermore, sound waves interact with particle sizes ranging from 0.01 to 1,000 μm, thereby covering a remarkably broad range. A sonic wave is sent through the dispersion, which is mechanically agitated to maintain a homogeneous suspension, and its attenuation is measured. The distance traveled by the sonic wave is accurately known. The attenuation measurement resulting from the various extinction mechanisms (viscous, thermal, scattering and diffraction) is repeated for a series of frequencies ranging from 1 to 150 MHz.
Two distinct approaches are being used to extract particle size data from the attenuation spectrum: an empirical approach based on the Bouguer-Lambert-Beer law and a more fundamental or first-principles approach [ 8 ]. The first-principle approach implies that no calibration is required, but certain physical constants of both phases — such as speed of sound, density, thermal coefficient of expansion, heat capacity, thermal conductivity, attenuation of sound, viscosity for fluid phase and shear rigidity for solid phase — are required for accurate measurements. Ultrasonic spectroscopy technology, developed in the early 1990s, is proving useful in the lubricant and food industries for measurement of oil-in-water emulsions at process concentrations. As this technology further develops and matures, it is anticipated that it will find a wider range of industrial applications, especially for online applications.
Edited by Rebekkah Marshall
References
1. Rolles, Rolf, and Luyk, Kenneth, Chapter 2: Aluminum Pigments and Aluminum-Pigmented Coatins, in “Treatise on Coatings, Vol. 3 – Pigments Part I” Myers, Raymond, and Long, J.S. eds., Marcel Dekker, New York, 1975.
2. Allen, T., “Particle Size Analysis” 4th ed., Chapmann and Hall, London, 1992.
3. Provder, T., ed. “Particle Size Analysis” ACS Symposium Series 332, American Chemical Soc., Washington, D.C., 1987.
4. Weiner, B.B., Chapter 3: Particle Sizing Using Photon Correlation Spectroscopy in “Modern Methods of Particle Sizing”, Barth, H., ed., Wiley Interscience, New York, 1984.
5. Trottier, Remi and Wood, Stewart, Particle Size Measurement, in “Kirk Othmer Encyclopedia of Chemical Technology”, Wiley Interscience, New York, 2005.
6. Wahl, B. J. and Larouche, P., Am. Ceram. Soc. Bull., 43, 377, 1964.
7. Eadie, F. S. and Payne, R. E., Iron Age, 174, 99, 1954.
8. F. Alba, C. L. Dobbs, and R. Sparks, Proc. SPIE-Int. Soc. Opt. Eng. 1430. 36 (1991).
Authors

Remi Trottier is a senior specialist in the Solids Processing Discipline of Engineering & Process Sciences at The Dow Chemical Co. (Phone: 979-238-2908; Email: [email protected]). He received his Ph.D. in chemical engineering from Loughborough University of Technology, U.K,, and M.S. and B.S. degrees in Applied Physics at Laurentian University, Sudbury, Ont. He has more than 20 years of experience in particle characterization, aerosol science, air filtration and solids processing technology. He has authored some 20 papers, has been an instructor of the course on Particle Characterization at the International Powder & Bulk Solids Conference/Exhibition for the past 15 years, and has authored an article on particle characterization for the “Kirk-Othmer Encyclopedia of Chemical Technology.”

Shrikant V. Dhodapkar is a fellow in the Dow Elastomers Process R&D Group at The Dow Chemical Co. (Freeport, TX 77541; Phone: 979-238-7940; Email: [email protected]). He received his B.Tech. in chemical engineering from I.I.T-Delhi (India) and his M.S.Ch.E. and Ph.D. from the University of Pittsburgh. During the past 20 years, he has published numerous papers on particle technology and contributed chapters to several handbooks. He has extensive industrial experience in powder characterization, fluidization, pneumatic conveying, silo design, gas-solid separation, mixing, coating, computer modeling and the design of solids processing plants. He is a member of AIChE and past chair of the Particle Technology Forum.
Stewart Wood is a research scientist in the Analytical Sciences Laboratory at The Dow Chemical Co. (Midland, MI 48667; Phone: 989-636-5555; Email: [email protected]). He received his M.S. and B.S. degrees in Chemistry from Clarkson University, Potsdam, N.Y. He has more than 26 years of experience in the areas of particle-, spray- and fluid-flow characterization technologies. He has been an instructor for more than six years at an ACS course on modern methods of particle size characterization and has authored a chapter on particle size measurement in “The Handbook of Instrumental Techniques for Analytical Chemistry”.