New self-service data analytics tools allow plants to create an analytics-enabled workforce that can readily address production issues and continuously improve processes
The specialty chemicals sector of the chemical process industries (CPI) is highly complex, from both a production and a market standpoint. Smaller batches (with a finite quantity) coupled with an ever-changing variety of raw materials, operating conditions and processes can present huge challenges to production teams. Increasing operating costs and a competitive market amplify those challenges. To maintain a solid market position, companies need to find new ways to remain innovative, sustainable and competitive (Figure 1).

Figure 1. Specialty chemical companies need to find data-analytics-driven ways to sustain their market position
One way to do so is by increasing financial flexibility to safeguard against commoditization. This can be done by getting as much out of existing production capacity as possible. In a market where growth is continuing, and rolling out new products is becoming more and more difficult, sustainability is crucial.
The production teams that will undoubtedly have a leg up will be the ones embracing the emerging technologies that have stemmed out of the rise of Industry 4.0. They are realizing the value that digitalization can bring when they are fully able to leverage the volumes of data at their disposal — on their own, without the need for a data scientist.
These forward-thinking organizations in the specialty chemicals market are turning to solutions like self-service analytics to create an analytics-enabled workforce, not only to strengthen their market position and create the most profitable factories of tomorrow, but to address critical production issues and make better-informed decisions.
When the information hidden in the data is properly connected to the knowledge in the minds of subject-matter experts (SMEs), an organization can finally move toward a proactive, data-driven process improvement strategy. Within the area of specialty chemicals, this means a digitally enabled workforce can efficiently increase throughput and quality by solving daily analytic challenges themselves, which leads to increased operating efficiency overall and a stronger market position.
All of the data in the world are meaningless if they are not being analyzed and acted upon. With self-service analytics, there is no need to create a cost-intensive data model. Its plug-and-play functionality and user-friendly interface means your organization can begin creating value immediately with minimal investments. Insights into a process and asset behaviors are based on a wealth of historical and real-time data that your plant already owns.
This article explains how self-service analytics approaches democratize the use of data analytics and provide real-world examples of how plants have used self-service analytics to improve batch processes.
All data tell a story
As with any niche market, working within specialty chemicals comes with its own specific targets and areas that organizations have to focus on and continuously improve upon. Increasing throughput, lowering energy consumption, and reducing non-productive downtime are just a few of the things that are important to a production team. However, achieving these goals is a much harder feat if all the available data is not being leveraged.
Decades of time-series data for thousands of sensors in a large production facility is overwhelming. Sifting through it using traditional methods is nearly impossible and many opportunities to potentially improve operational performances are overlooked. Spreadsheets will always be a staple in terms of office software, but as a tool for aggregating and analyzing data, it simply isn’t enough.
In order to quickly make decisions affecting their day-to-day operations, engineers and other SMEs need to be able to search time-series data over a specific timeframe and visualize all related plant events quickly and efficiently (Figure 2). Additionally, a level of operational intelligence and understanding of data is required to improve process performance and overall efficiency.
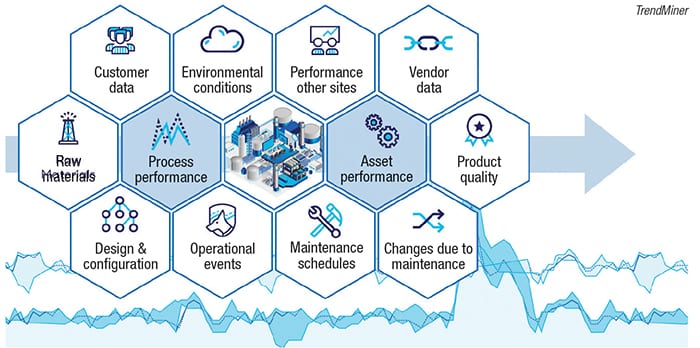
Figure 2. To help with decision-making, engineers need to be able to visualize all related plant events quickly and efficiently. Data tell more stories when data silos are unlocked
As the amount of accessible data for producers and manufacturers continues to grow, it is only natural that new ways to handle data are needed. The rise in digitalization is less about providing production teams with new tools, but rather new ways of working and executing day-to-day operations. Advanced analytics can be used by CPI companies to monitor production, address complex issues, and extract information on assets and processes without lengthy data-modeling by analytics experts.
So whether you are looking to reduce cycle time, find the root cause of a quality deviation, or predict the evolution of your batch, you will need to go through your sensor-generated time-series data. And if you find yourself consistently in a reactive stance with your analysis to keep the plant running, you could be missing opportunities for proactive process improvements.
Democratizing analytics
Data analytics is a necessary part of any organization that wants to measure and track operations and make informed decisions. Business consulting firm Gartner (www.gartner.com) lists four different types of analytics. These four types generally grow in complexity, but all serve a purpose within the analytics value chain.
Descriptive analytics: What is happening in my operations? This type of analytics is the most common and perhaps the simplest, but nonetheless vital. It provides the insights and key metrics needed to visualize and understand your operations. Think of descriptive analytics as the “who, what, when, where, how and how many” of basic reporting. With self-service analytics, engineers can visualize their operations to fully understand what is happening at all levels.
Diagnostic analytics: Why is this happening in my operations? Diagnostic analytics is just as it sounds: it is used to uncover why an event occurred and then determine the root-cause of the problem. This is a particularly useful form of analytics when dealing with time-series data because it helps you understand the cause and effect between various data sources, as well as identify patterns. With a pattern recognition-based self-service solution that is responsive and intuitive, process data can be analyzed and interpreted. That is the key to closing the analytics skill gap and bringing advancements to where it matters: the process experts.
Predictive analytics: What will happen in my operations? Predictive analytics takes things a step further. This form of analytics uses your data — and the findings from descriptive and diagnostic analytics — to predict specific outcomes based on trends and dependencies. Predicting anything from equipment failure to production evolution, predictive analytics allows you to make decisions that could have giant impacts in your operations. Historically, the only way to predict the behavior of batch processes had been by building complex data models. These models are difficult to build, costly to maintain, and the results are hard for process experts to easily interpret. New approaches (such as self-service analytics) are available that are fast and iterative, easy to interpret and robust. Process experts using self-service analytics can now tackle predictive analytics independently, which can lead to, among other things, debottlenecking central data-science departments.
Prescriptive analytics: What do I need to do in my operations? This final form of analytics takes all of your data, insights gathered and trends produced, and determines potential future courses of action. Prescriptions require a good diagnosis, so it often comes down to pre-described suggestions that allow the SMEs to take appropriate actions on the notifications they receive, and the instructions provided by the system (Figure 3). With every new situation, knowledge expands for fast and appropriate action when early warnings are sent or needed action is predicted by the system. We call this user-driven machine learning. In a very complex specialty chemical environment with small batches, this is crucial.
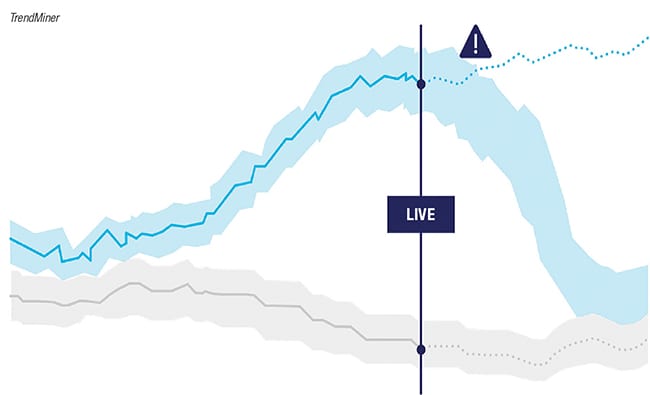
Figure 3. Rapid-fire pattern recognition predicts future operational behavior, allowing timely action. Pre-described suggestions allow subject matter experts to take appropriate actions on notifications they receive
Within a chemical plant, any or all of the aforementioned analytics are necessary in order to address the issues and goals that production teams are facing. Traditionally, data scientists have been required in order to solve complex issues. Having to rely on data scientists or central analytics teams to create data-driven solutions or resolve any data analysis-related questions, however, can lead to missed opportunities that can be costly in terms of time and money.
So how exactly does the plant engineer, maintenance engineer, safety engineer or production engineer go about analyzing data without traditional models? This can be done by enabling the masses, so that not only analytics specialists, but the vast majority of a company’s employees can utilize the data. That means making business intelligence (BI) and analytics tools accessible to business users and SMEs so they can analyze the data and derive new insights just by using their particular expertise, without needing to acquire sophisticated analytics skills.
This is best described as the democratization of analytics. And there is actually no better way to implement that than using self-service analytics.
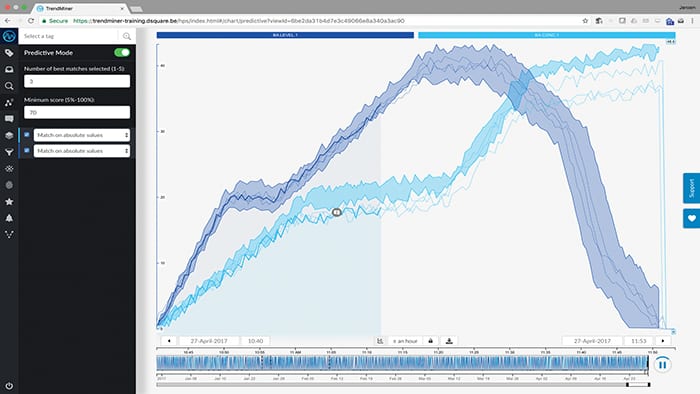
Figure 4. Self-service analytics can be used to effectively visualize, analyze, monitor, contextualize and predict operational performance TrendMiner
Self-service analytics explained
Self-service analytics leverages smart data combined with the tactical expertise of those at the production site. It puts the power of the data into the hands of those who really need to interpret it (Figure 4).
All four types of analytics, from descriptive to predictive, can now be performed by operators and engineers. Besides visual analytics, self-service analytics software can provide various tools, filters and advanced queries to find anomalies, create early warnings and troubleshoot incidents across multiple assets. For example, an incident during production may seem like a single occurrence, but with rapid-fire pattern recognition technology, it may turn out that the incident has happened multiple times over the past few years.
Engineers investigating potential process optimizations may start by searching for specific anomalies in process behavior. Searching for tags is as easy as searching in Google where easy time sliders and filters help you navigate through years of data. The first question is “what has happened?” directly followed by “has this happened before?”. If multiple occasions are found, the engineer can start searching for root causes using either influence factors or a recommender engine.
Additionally, periods of best performance can be collected and overlaid to create fingerprints (for the process) or best operating zones (for the assets) that can be used as monitors. The monitors can be used to capture events, while events reside in other third-party business applications, such as maintenance management or laboratory information management systems. All this can lead to new starting points for process optimization, leading to a continuous-improvement loop through data analytics and contextualization of operational production data.
Building a production cockpit
Ideally, all operational stakeholders would have what we refer to as a “production cockpit” to work with that is complete with a dashboard, analytics suite and agile communications facility. Users can create and share complete and live overviews of their current process statuses and performances, enabling teams and individuals to immediately access production data, analyze situations at hand, and make decisions in an instant.
When you enhance the current process status overview with the early-warning capabilities that self-service analytics solutions provide, the production cockpit can provide operators the opportunity to be proactive and optimize operational performances, even before issues arise. It also helps optimize the flow of information between shifts, from shift teams to engineers and between all related actors and production stakeholders, thereby boosting the organization’s collaborative agility. These are just a few of the ways that self-service industrial analytics is able to cater to the needs of engineers today.
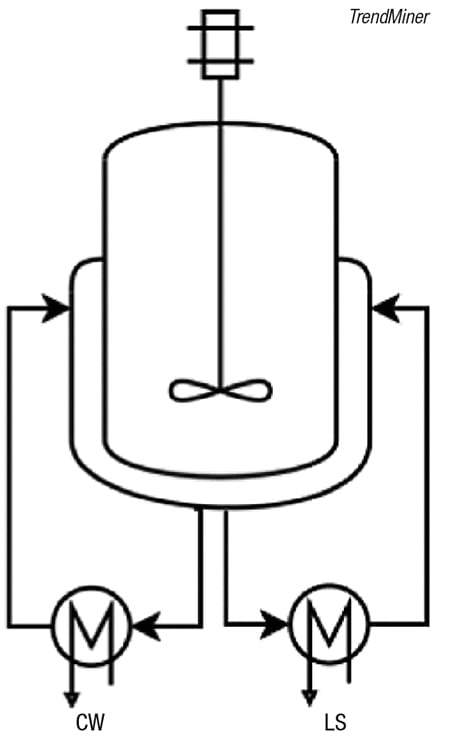
Figure 5. Self-service analytics helps predict heat exchanger fouling, and control the process to avoid it
Real-world use cases
Predicting fouling of heat exchangers. In a reactor with subsequent heating and cooling phases (Figure 5), the controlled cooling phase is the most time-consuming, and it is almost impossible to monitor fouling when the reactor is used for different product grades and a different recipe is required for each grade. Fouling of heat exchangers increases the cooling time, but scheduling maintenance too early leads to unwarranted downtime and scheduling too late leads to degraded performance, increased energy consumption and potential risks.
Under normal process conditions, self-service analytics can be used to identify a general trend for predictive-maintenance planning, alert and support a maintenance decision, and help find the right process parameters to tweak in order to lengthen the time between maintenance cycles. However, fouling can also be caused by other factors — the viscosity of the process fluid changed, the temperature of the heat-transfer fluid changed, and others. In this situation, self-service analytics can be used to diagnose and prevent these specific fouling cases by detecting the root cause (that is, process anomalies upstream), and used to predict when engineers need to be alerted.
In one instance in the production of a polymer, a specialty chemicals company used a visual trend analysis to determine the influence factors of the fouling that was occurring. To enable a timely maintenance, a monitor was set up to look at cooling times of the company’s most highly produced products. If the duration of the cooling phase started to increase, a warning would be sent to the engineers, who could then get maintenance scheduled.
Self-service analytics allowed the engineer to set this up in less than an hour, and it ultimately resulted in extended asset availability, reduced maintenance costs, reduced safety risks and controlled energy consumption. All of these benefits ultimately led to more than 1% overall revenue increase of the production line, while maintaining stable product quality.
Yield increase through cycle-time reduction. A specialty chemicals company produces specialized fibers that are subject to strict quality constraints. The final performance of the process is measured through metrics such as cycle time, end product quality and yield.
Gradually over time, the production of the fibers began to run suboptimally. Recent batches were taking longer to complete, which led to increased cycle times. Despite previous optimization efforts, plant engineers were unable to identify and address the cause of these cycle-time delays.
Through a simple set of steps using a self-service analytics platform, the team quickly identified the best batches from five years of operational data. These batches were layered with recent suboptimal batches, which revealed a key optimization opportunity (Figure 6).
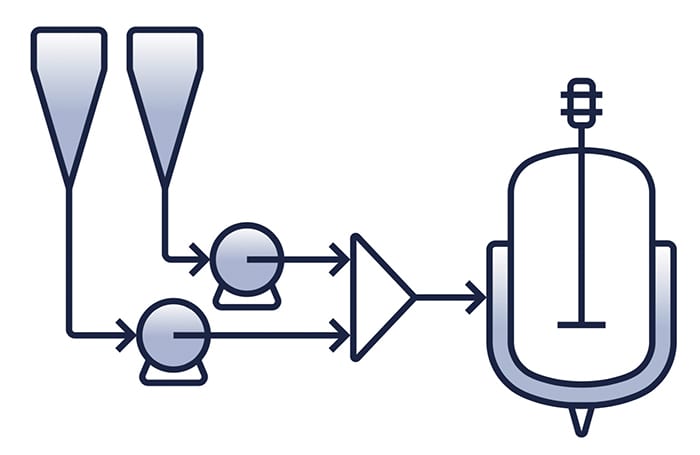
Figure 6. Self-service analytics can allow engineers to quickly find the root cause of a process problem and adjust batch cycle time, for example Image courtesy ofTrendMiner
First, the team used a value-based search and filter functionality to find all relevant batches. Next, they sorted the results by duration to identify the production batches with the highest yield and shortest cycle time. From there, engineers layered approximately 15 ideal batches from a 5-year period where a visual comparison of the layers revealed their ideal “golden batch” profile (Figure 7). The final step consisted of overlaying 10 recent batches on top of the golden batch profile created in the previous step. Immediately, a clustering became apparent. Midway through the full batch cycle, the recent batches significantly deviated from the historically best performers.

Figure 7. Use best-performance fingerprints to monitor performance and avoid production stops
Subject matter experts could immediately recognize that this was related to a change in the ramping up of a raw material feed. Material was being added at a slower rate compared to historical golden batches. They were able to determine that increasing the raw material feedrate would allow them to revert back to their previous performance and reduce their cycle time.
The engineers had been faced with increased cycle times for quite a while, leading to tangible production and revenue losses. Leveraging the analytics capabilities of a plug-and-play solution, the root cause was identified, and a solution could be developed. The improvement potential was around 30 minutes on a 9-hour batch cycle, which translated to an estimated $1 million per year in business value. The engineers were able to do all of this in four hours.
Additional examples
Reduce emissions by improving off-gas treatment. A chemical company was experiencing problems during off-gas treatment. With data from their data historian, combined with search and discovery analytics, they were able to do a hypothesis check quickly and easily. Confirming their hypothesis enabled the team to decrease problematic situations with off-gas treatment by 63%, and by doing so, greatly reduce emissions as well.
Production quality optimization. In this case, a team at a chemical plant was experiencing a poor-quality production run for which the root cause was not clear. The team used self-service analytics software to compare good quality periods with bad quality periods in production runs. Through the software’s layer compare feature, they were able to easily identify what caused the problem. It helped them to ensure high quality production runs in the future.
Eliminate a potential production loss. Process engineers at a chemical facility were experiencing unwanted production stops. By tagging good batches as “fingerprints” they were soon able to identify deviations in production runs, leading them to a problem in the control system. Finding the root cause with fingerprints helped them eliminate a potential production loss of 125 tons, or almost $300,000.
Energy monitoring without spreadsheets. Energy monitoring is an important factor when addressing sustainability. In the past, one chemical company would use Excel files to manually compare energy consumption data from one year to another. Self-service analytics now allows the engineers to easily bring a certain year into focus. By adding the following years of energy consumption as layers, they are able to easily compare large periods of time without needing to use Excel.
Edited by Scott Jenkins
Author
 Edwin van Dijk is the vice president of marketing at TrendMiner N.V. (Kempische Steenweg 309/5 Corda Building 2, 3500 Hasselt, Belgium; Website: www.trendminer.com; Email: [email protected]; Phone: +31 612724172). Van Dijk has over 20 years of experience in the process and power industries. Within TrendMiner, Van Dijk is responsible for the global marketing strategy, which includes a focus on educatin8g the market on the benefits of data analytics in the process industry and the opportunities available with TrendMiner’s solutions. His team will also focus on corporate positioning, driving customer acquisition, loyalty and retention programs, and helping to increase global brand recognition. Prior to joining TrendMiner, Van Dijk held various roles within BlueCielo, where he was an integral part of BlueCielo’s evolution to expand this solution into today’s corporate market positioning. In his last role as director of global marketing, he focused on brand recognition, product positioning and go-to-market launch plans, lead generation through integrated global campaigns and measurability of marketing effectiveness.